
JapanJP
Mario, Zelda and Pokémon are Japanese, and so is a good deal of the vocabulary gamers are accustomed to: the boss fight, the JRPG, and the fighting game. Home consoles may have been an American invention, but Japan rescued them after the industry collapsed in the eighties and still exports that canon at scale. Content exports reached 5.8 trillion yen in 2023, of which games were 62 percent, a total the industry association says already exceeds Japan's semiconductor and steel exports. At home the picture is quieter: a 2.4 trillion yen market in 2024 and a player base of 54.75 million that is edging down. And the country that sells the world its games is the hardest market in this directory to research. Nintendo publishes lifetime unit sales for every major title for free, while the two national data annuals cost between 48,000 and 55,000 yen each, so headline national figures reach the public through press releases only. The largest games media brands and both data annuals share one corporate parent.
Market size2025
~2.6 trillion yen
Famitsu Game White Paper 2026, Kadokawa ASCII Research Institute, publisher release
Game population2024
54.75 million
The figure is the game population, ゲーム人口, stated as 5,475万人, against 5,553万人 the previous year, which CESA calls a slight decline, 微減.
Rough scale only. Every market counts players differently, and MENA and IN have no figure.
一般社団法人コンピュータエンターテインメント協会 CESA, CESAゲーム産業レポート2025 (CESA Game Industry Report 2025)
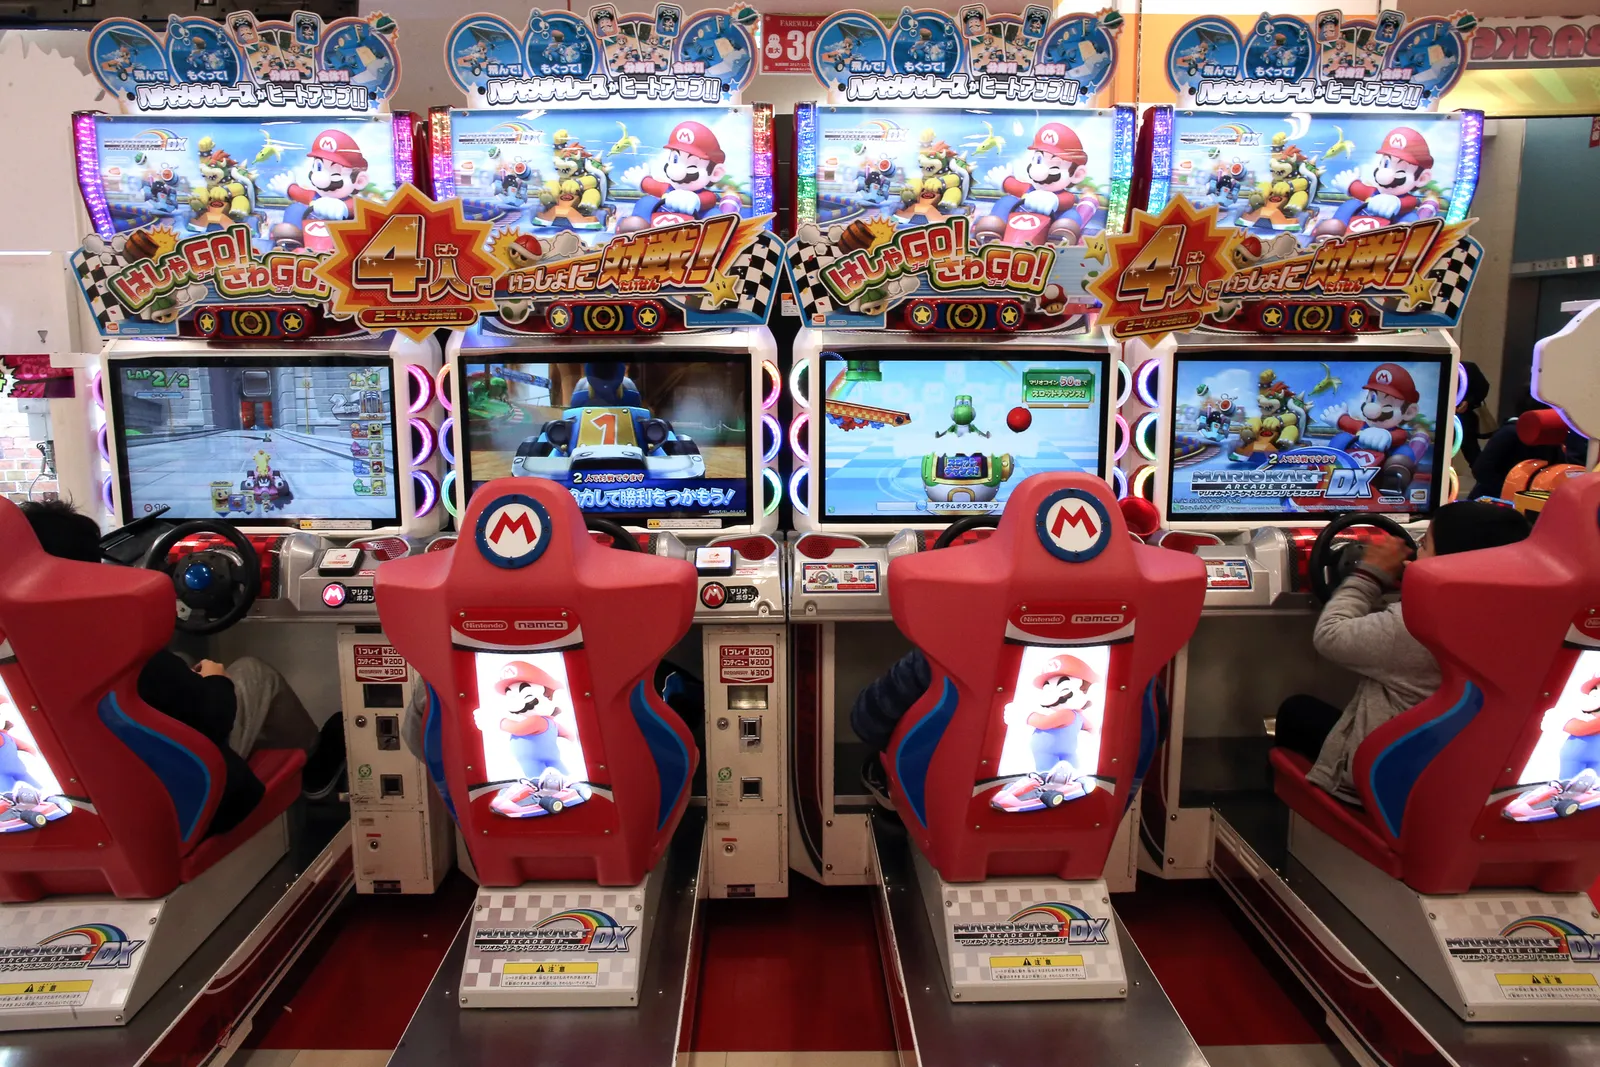
Photograph Wired.com
Shape
Japan game population is 54.75 million in 2024, a slight decline from 55.53 million the previous year, with 42.78 million on mobile, 29.51 million on console and 14.52 million on PC. Console players roughly double PC players.
Multi device play is near half the player base. 24.78 million people play on two or more of console, PC and mobile in 2024, which the publisher highlights as a marked increase.
Famitsu Game White Paper 2025, Kadokawa ASCII Research Institute, publisher release
Japan makes and exports games as well as buying them. Content industry exports reach 5.8 trillion yen in 2023, of which games are 62 percent, a total CESA states already exceeds Japan semiconductor and steel exports.
Research note
The two annuals carry different years for the same series, so quote the year with the figure. Famitsu's white paper lands in August with the previous calendar year: the 2026 edition gives 56.39 million players for 2025, up 3.0 percent on 54.75 million for 2024. CESA's report lands in December with the year before that: the 2025 edition still carries 2024. The gap between them is the calendar, not the method.
Famitsu Game White Paper 2026, Kadokawa ASCII Research Institute, publisher release
Where players talk
YouTube, the default open video venue
YouTube reaches 81.5 percent of Japanese people aged 13 to 79 and is the default open video venue. TikTok reaches 36.7 percent.
X, the main open text venue. Facebook is marginal
Do not default to Facebook for Japanese games talk. X reaches 44.7 percent of people aged 13 to 79 and is the main open text venue; Facebook reaches 27.0 percent, the lowest of the platforms measured. The guidance rests on reach, not on a games-specific measure.
LINE, private messaging, not publicly searchable
LINE conversations are private. It reaches 92.9 percent of people aged 13 to 79, more than any other service, and none of its conversation is publicly searchable, so it is not a listening venue. That LINE is private is a reading of the product type, not a survey finding.
Niconico, KADOKAWA owned
Niconico, historically a central Japanese video venue, is owned by Dwango, a KADOKAWA subsidiary. A ransomware attack on 8 June 2024 took the service offline for about two months, with full relaunch on 5 August 2024.
Unverified
Do not name 5channel as a live games venue without checking it yourself. The anonymous boards under 5ちゃんねる (formerly 2channel) are commonly described as one, but their current scale, ownership and games-board activity could not be verified to standard from outside Japan.
Research note
The MIC survey measures reach, not games use. Its percentages say how many people aged 13 to 79 use each platform at all, so use them to choose which venues to read and not to size a games audience on any of them.
Ministry of Internal Affairs and Communications media usage survey, government survey
Where the data lives
The seven places to open first. The full list of 139 is at the bottom of the page.
CESA ゲーム産業レポート (Game Industry Report)
CESA ゲーム産業レポート (Game Industry Report). The industry association annual gives national game population by platform, a global market estimate, user survey results and industry data, with headline figures free in each December release.
ファミ通ゲーム白書 (Famitsu Game White Paper)
ファミ通ゲーム白書 (Famitsu Game White Paper). The annual gives domestic and global market sizing, platform breakdowns and user survey data, with headline figures free in each August release. The mobile edition global data is supervised by Sensor Tower.
ファミ通 weekly sales rankings
ファミ通 weekly sales rankings. Weekly estimated unit sales for packaged console software and hardware in Japan, free, published every week.
任天堂 IR (Nintendo investor relations)
任天堂 IR (Nintendo investor relations). Primary corporate disclosure with regional sales splits, hardware and software unit sales by quarter, cumulative top title sales and long run historical data.
経済産業省 (METI) creative industries strategy
経済産業省 (METI) entertainment and creative industries strategy. The June 2025 government action plan analyses the games business segment by segment, console, PC, mobile and esports, with export policy context.
総務省 (MIC) media usage survey
総務省 (MIC) media usage survey. The annual government survey gives platform usage rates by age band for LINE, X, YouTube, Instagram, TikTok and Facebook, the standard free source for venue triage in Japan.
The State of Video Gaming (Ball, Epyllion)
The State of Video Gaming, Matthew Ball and Epyllion. A free annual analyst presentation with market sizing, participation and platform charts for most major markets, useful for cross market comparison that no single free source provides. It aggregates many vendors rather than applying one methodology, so treat figures as the analyst assembly they are and cite the underlying source where the deck names one.
Research note
There is no CESA white paper any more. The CESA ゲーム白書 ran to 2023 and was replaced in 2024 by the CESA ゲーム産業レポート (Game Industry Report), out each December; the 2025 edition was released on 15 December 2025 at 55,000 yen. Anything that cites the white paper is citing a pre-2024 source.
People
Communities
5ch (5ちゃんねる)
JP anonymous forum culture, where the game boards show unfiltered player discourse; the substrate the matome ecosystem feeds on. Its current scale, ownership and games-board activity could not be verified from outside Japan as of Sep 2026, so check a board's recent post dates before treating it as a live venue.
Yahoo! Chiebukuro (知恵袋)
What ordinary JP players and parents actually ask, in their own words. Japan's direct analogue to Naver 지식iN. Good for parent anxieties in the wild.
note.com
Where JP developers, analysts, and superfans write long-form. Basically a JP Substack, Japan's Medium. Quality is author-dependent.
Girls Channel
Anonymous Japanese forum launched in 2012 as a self-described women's 2channel, where admin-approved topics (トピック) on celebrity gossip, TV, family life and parenting run for 30 days with plus and minus voting on every comment. Its user base is predominantly women and skews older and married, which makes it a useful register for how mothers and housewives talk about children's games, screens and spending.
Ore-teki Game Sokuho JIN
まとめサイト (matome site) that repackages 5ch threads, social posts and news into high-volume posts with editorial commentary. Running since 2006 and one of the two highest-traffic Japanese aggregators in games discourse. Useful for seeing which stories are travelling and how they are being framed for a mass Japanese audience. Coverage has widened well beyond games into celebrity, politics and general news. Content is rewritten rather than reported, so treat every claim as needing its primary source.
Hachima Kiko
まとめサイト (matome site) founded June 2007 by 清水鉄平 (Shimizu Teppei), repackaging 5ch threads and social posts with editorial commentary. Its own 2025 media kit claims 55 million monthly page views and 8.8 million monthly unique users, with an audience roughly 7 to 3 male and concentrated in the 25 to 34 band. Useful for gauging what reaches a mass Japanese audience and in what register. Coverage now spans games, anime, manga and general news, and content is rewritten rather than reported, so treat every claim as needing its primary source.
Mamastar Community
Parent forum. Lived-practice texture.
Pixiv Encyclopedia
User-written wiki attached to the illustration platform pixiv that documents the tags on fan art, so its entries explain characters, pairings, tropes and visual conventions in the terms fan artists actually use. The quickest way to decode an unfamiliar fandom tag or understand which characters and motifs a fan community is drawing and why. Community wiki.
Niconico Pedia
Dwango-run wiki (大百科, daihyakka, "great encyclopedia") that explains the tags, memes and slang of Nico Nico Douga, with each entry carrying its own comment board (掲示板, keijiban) where users react in real time. Strong for tracing the origin and evolution of Japanese net memes, game slang and vocaloid-era video culture, with the comment boards doubling as a live sentiment feed.
Game8 (ゲームエイト)
Japan's largest walkthrough media by its own count (42 million monthly unique users, up to 500 million page views), a 100% Gunosy subsidiary with an English edition. Traffic per title is a proxy for which mobile and console games have active players. Guide sites are ad-funded and built to rank in search, so read traffic as engagement, not sentiment.
GameWith (ゲームウィズ)
The other national-scale guide site, run by GameWith, Inc., listed on the Tokyo Stock Exchange (6552) since 2017 and so the one guide business with public accounts; its results are a window on the guide-media economy, and it has expanded into esports and a gamer ISP.
139 curated sources for Japan
Research it yourself
These rows
20 of 20 sources
| Name | What it lets you find out | Type | Cost | Markets |
|---|---|---|---|---|
| Famitsu sales data (KADOKAWA Game Linkage) | The Japan sales standard: weekly hardware and software charts as estimated units of packaged software, download cards and pre-installed copies. Direct digital-store purchases, mobile and PC are outside it. Figures are trade-reported rather than sold as a product. | Sales tracking | Free | |
| Game Data Library | Historical Japanese sales data in English, useful for longitudinal JP questions. Community-run archive of Famitsu/Media Create data. Verify against a primary where stakes are high | Sales tracking | Free | |
| User Local VTuber Ranking (ユーザーローカル VTuberランキング, Yūzā Rōkaru) | The standard public VTuber population/ranking dataset by agency, subscriber count and growth (widely cited by JP financial press). VTuber vertical only, ranked on a subscriber-count basis | Creator tracking | Free | |
| kamui tracker (カムイトラッカー, Kamui Torakkā) | Covers every domestic YouTube channel above 1,000 subscribers (~229k channels, ~83M videos) including agency-affiliation and sponsorship-deal search (deepest JP YouTube dataset). Paid, Japanese only, YouTube only Trial available, enterprise-leaning. | Creator tracking | Paid | |
| Hakuhodo Institute of Life and Living | Long-running 生活定点 longitudinal survey. Agency-owned but methodologically serious. | Adjacent research body | Free | |
| SHIBUYA109 lab. | Specialist on youth "around-20" (15-24). Monthly hearings with 200 young people. Coined 界隈消費 and tracks アテンション疲れ. | Adjacent research body | Free | |
| Benesse Research Institute | Primary survey research on children, parents and media use. | Adjacent research body | Free | |
| AJA (Assoc. of Japanese Animations) | Publishes アニメ産業レポート, the anime industry data annual. Free summaries, the full report is paid. | Adjacent research body | Freemium | |
| Nintendo IR | Hardware/software splits per region, million-seller lists, management Q&A | Corporate IR | Free | |
| Sony Game & Network Services (IR) | PS5 sell-through, PS Plus, first-party performance in segment reporting | Corporate IR | Free | |
| NetEase IR | Second biggest CN major with notable JP studio investments | Corporate IR | Free | |
| Nexon IR | Founded in Korea but listed in Tokyo, offers per-title and per-region detail and the economics of live-ops | Corporate IR | Free | |
| Capcom IR | Per-title lifetime sales through the Platinum Titles database, which is the most detailed public disclosure any Japanese publisher offers. Regional revenue splits and digital share are given each quarter. | Corporate IR | Free | |
| ANYCOLOR IR (にじさんじ / Nijisanji) | Quarterly filings disclose talent counts, revenue mix, and per-segment economics of the VTuber business | Corporate IR | Free | |
| Cover Corp IR (ホロライブ / hololive production, Hororaibu) | Primary disclosure for hololives | Corporate IR | Free | |
| Square Enix Holdings IR | Segment reporting across HD games, MMO, mobile and publishing, plus write-downs that show which strategies were abandoned. Fiscal year ends 31 March. | Corporate IR | Free | |
| Bandai Namco Holdings IR | The clearest public view of an IP axis strategy, with toys, games, arcade and visual media reported side by side. Useful for understanding character IP economics rather than games alone. | Corporate IR | Free | |
| Konami Group IR | Digital entertainment reported alongside amusement, gaming and sports segments. Shows how a Japanese publisher balances games against pachinko and casino gaming machines. | Corporate IR | Free | |
| Sega Sammy Holdings IR | Entertainment contents reported next to pachislot, pachinko and resorts. Impairments on acquisitions such as Rovio are visible here before they reach trade coverage. | Corporate IR | Free | |
| Nintendo newsroom (What's New) | Nintendo's own announcements to players: Direct presentations and what was shown in them, hardware and software pricing, and release dates, as the company states them rather than as they are reported. Separate from Nintendo IR, which carries the financial disclosure. | Corporate IR | Free |